

The benchmark everyone trusts is structurally skewed.
The $50 trillion passive industry runs on one idea: market-capitalisation weighting, traceable to Laspeyres' price index of 1871. It was adopted for calculational convenience — and it carries an intrinsic positive bias. As a stock rises, it earns a bigger weight, so the index buys more of it.
That is a rich-get-richer machine — it mistakes momentum for merit and quietly concentrates risk in a handful of names. A 150-year-old convention, not a law of markets. 3N treats it as only half the story.
3N™ was designed — over fifteen years.
Each layer of the framework traces to peer-visible work, published openly on SSRN since 2010. The methodology is the accumulation of that record.
{{ e.detail }}
The 3N framework
One idea — that markets are neither purely Normal nor purely Non-Normal — turned into a probabilistic engine. Here it is explained two ways: the plain picture first, then the mechanics underneath. Both are driven by the same control.
Two jars, five hundred balls
Picture the market as a jar of 500 balls — one per stock. In one jar only a handful, about seven, actually move: they swell and shrink while the other 493 sit still. In the other there’s no fixed set — all 500 are always breathing, a different scatter growing and fading every moment. Real markets look far more like the first jar — so 3N reads all 500 at once to find the few that carry it at a given moment, rather than assuming in advance which they are.
THE METHOD → Diversifying blindly across all 500 just grows at the market average; concentrating on a fixed few misses the rotation. Smart diversification is the edge — if you can estimate each stock’s chance of growing, you can tilt a broad basket toward the balls about to swell and away from those that aren’t. That’s what 3N measures: each stock as odds, not a verdict — how likely it is to persist (keep swelling), revert (shrink back), or sit in transition. The chain below is how those odds are actually measured. Diversify toward the balls with better odds of growing — and capture the rotation.
Take a real five-threshold model of the market — five return states a stock moves between, each shown in its own colour. It’s a Markov chain: for every state, the odds of staying put plus the odds of leaving for each other state always sum to 100%. Every link is two-way — a coloured number leaving each state and another coming back, and the two need not match. Over a single day each state holds 100% of itself — five disconnected circles. Lengthen the horizon and each state first leaks into its neighbours, tying the circles into a chain; then probability jumps two states at a time, folding that chain into a shape; until, over long horizons, every state reaches every other and self-persistence falls near 50% — a fully-connected polygon that is far less predictable.
This is where portfolio construction comes from. At each rebalance 3N reads every stock’s current transition odds and overweights the states with the highest probability of persisting or improving over the target horizon, underweighting those most likely to decay — sizing each position by its measured edge, not by market value. These are conviction holdings, not short-term trades: positions are held while the odds stay in their favour and turned over only as the probabilities shift.
Ring thickness = self-persistence · each link carries two directional odds, coloured by the state they leave. After Pal, “The [3N] Model of Life” (SSRN 3830047).
Order, disorder & the state between
Markets modelled as a Markov chain across multiple probabilistic states — every asset carries measurable odds of persistence, reversion or transition.
Balancing Normal & Non-Normal
Value bets on reversion; cap-weighting bets on persistence. 3N measures the prevailing regime and normalises across both — correcting for recency, anchoring and confirmation bias.
The market's fingerprint
Every stock has a fingerprint — the pattern in how it really moves. Machine Beta rebuilds the index from these non-linear structural factors rather than market value, learning the structure of returns directly, at lower tracking error.
A better basket, measured against the S&P 500
The 3N basket — Exceptional & Rich (E&R) — ranks the market on relative cap growth rather than size. We didn't back-test for winners: since January 2014 a portfolio was launched every single month-end — 324 in all — and run on one-, two- and three-year clocks. Every start date, every cadence, no discretion. When a design wins from any starting point, it isn't luck — it's structure.
The outcome: a rules-based basket active managers can run as a benchmark-beating strategy — broad enough to track the market, tilted enough to beat it.
Reconstruction of the book’s Figures 5–12; excess-return and drawdown magnitudes read from the published charts, growth compounds the stated annual excess over the S&P 500. Illustrative of the case study, not a live composite. Source: Pal, End of Passive Investing (2025), ch. 11.
The end of passive isn't a slogan. It's a measurement.
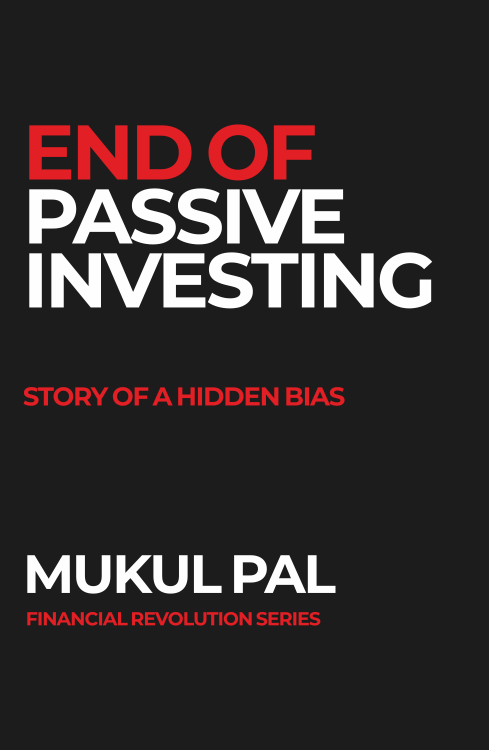
Passive investing promised neutrality and delivered concentration. End of Passive Investing traces the hidden bias from its 1871 origin to the present, and lays out why the next era of investing is intelligent, adaptive and aligned — paid only for the alpha it produces.
Read the book →Researched, attributed, forward-tested — every strategy earns its way live.
{{ p.detail }}
The full research record
Every paper below is publicly available on SSRN. Together they trace the derivation of 3N from first principles — time, probability, mean reversion, value, and finally machine-learned factors. Filter by research theme:
{{ activeDesc }}
See 3N in live portfolios.
The same engine, run as a dollar-neutral spread.
In plain terms: we buy the redesigned, scientific portfolio and sell the winner-biased, concentrated index it replaces — the same stocks, put together two different ways. You keep only the gap between them, so it can make money whether the market rises or falls, with no borrowing and a steady, low-risk ride.
Long the 3N™ allocation, short its cap-weighted benchmark — same universe, opposite construction. The industry trades factors; this isolates the structural spread between two ways of building the same portfolio, without leverage, at 6–8% target volatility.
Explore Structural Long–Short →